What were you doing in 1995? I was graduating from Medicine Hat High School and just starting down the path of almost 30 years of education and experience in economics and finance.
Why am I bringing up the 1990s, you ask? No, it’s not because it was the last time a Canadian team won the Stanley Cup (1993 Montreal Canadiens) with playoffs just around the corner. The reason is, the mid-90s was the last time the U.S. economy experienced a ‘soft landing’ and coincided with a remarkable increase in U.S. stocks, which would come to be known as the ‘dotcom’ bubble.
Many market strategists are drawing comparisons between the current U.S. economy and stock market and that of the mid-to-late 1990s. This is because it appears the U.S. Federal Reserve has been able to engineer a ‘soft landing’ for the U.S. economy – increasing interest rates to reduce inflation without creating a large increase in unemployment.
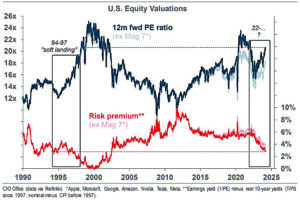
In this week’s chart, we explore the 1990s analogy from the perspective of stock market valuation (risk premium & PE ratio).
Risk premium is a measure of the premium shareholders are paid to own stocks instead of bonds – bonds are generally considered to be less risky than stocks, therefore, holders of stocks must be offered a higher return.
This premium is calculated by subtracting the risk-free government bond yield (interest rate) from the expected earnings yield of the stock market (inverse of the PE ratio). The Price-to-Earnings (‘PE’) ratio is simply the price of a stock divided by its earnings. PE ratios can also be calculated for indexes like the S&P 500 by summing the share prices of the 500 companies in the index and dividing it by the sum of the 500 companies’ earnings.
The supplied chart shows the U.S. stock market is trading at a similar valuation to the mid-1990s from the perspective of risk premium, however stocks are more expensive in the current period from the perspective of price-to-earnings.
You will also notice the U.S. stock market isn’t yet at the extreme valuation levels seen during the ‘dotcom’ bubble. As you can see, prior to the ‘dotcom’ bubble bursting in March of 2000, the risk premium offered on U.S. stocks was zero (investors weren’t being paid any premium to invest in stocks over bonds) and the average price of stocks were trading at approximately 25 times forward earnings.
The main lesson gleaned from this week’s chart is the relationship between risk and return – investors need to be paid a higher return to own riskier assets (i.e. stocks vs. bonds). When the risk premium is at or near zero, it is an indicator that stocks are relatively expensive, and their near-term upside may be limited.
The same concept applies to the PE ratio, when it approaches extreme levels (i.e. ~25 times forward earnings), near-term upside may be limited for stocks.
We aren’t there yet; however, artificial intelligence euphoria could push U.S. stocks to valuation levels last seen in the late 1990s.
Eric Van Enk is a wealth adviser & associate portfolio manager with National Bank Financial in Medicine Hat. He is a graduate of the University of Calgary, as well as a CFA charter holder with 20 years of financial markets experience in New York, Toronto and Calgary. He can be reached at eric.vanenk@nbc.ca


[…] Source link […]