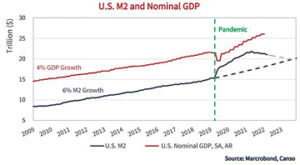
Chart taken from the Canso Market Observer dated April 2023 prepared by Canso Investment Counsel Ltd. For full copy please see cansofunds.com.--SUPPLIED IMAGE
A key factor driving stock market performance is also one of the most overlooked – M2 money supply.
The rate of growth in the supply of money is highly correlated to the performance of stocks which perform well when central banks increase money supply and tend to correct when money supply is reduced.
I borrowed the referenced chart from one of our service providers (Canso) who are one of the top bond managers in Canada. This chart shows the relationship between money supply (M2 Growth) and GDP in the U.S. since the Global Financial Crisis. Notice the correlation between the supply of money and the rate of GDP growth with U.S. money supply averaging 6% annual growth while U.S. GDP averaged 4% annual growth from 2009 until 2020.
You will also notice the spike in the supply of money in response to the COVID pandemic (green dotted line). This increase in money supply wasn’t simply a U.S. phenomenon – every major central bank injected significant liquidity into their respective economies in response to the pandemic given the dramatic decrease in GDP resulting from COVID lockdowns.
Stocks reacted rationally to the onset of COVID (large correction in early 2020) and subsequently to the historic increase in the supply of money. Stocks bottomed in the spring of 2020 and rallied sharply for nearly two years. Central banks have two primary monetary policy tools – interest rates and money supply.
Central banks used both tools aggressively after the onset of the pandemic by cutting interest rates to levels approaching 0% and dramatically increasing the supply of money. Interest rates are straightforward – lower rates make it less expensive to borrow which expands the economy by encouraging borrowing and spending.
Money Supply (M2 Growth) is less well-understood.
The U.S. Federal Reserve led global central banks in their monetary policy response by using the ‘nuclear’ option, aka, Quantitative Easing (“QE”). QE involves central banks buying bonds from private investors which forces the price of bonds higher and their corresponding interest rates lower.
Buying bonds injects liquidity into the financial system as sellers of bonds receive cash. Excess cash leads to additional spending and inflation as a larger supply of money chases the same amount of goods for sale. Money supply is increased when central banks ‘print’ money to finance their purchase of bonds.
What goes up, must come down – the pandemic-driven increase in money supply is now being reversed as shown in the referenced chart. U.S. money supply is currently contracting on a year over year basis for the first time in decades – if an increase in money supply led to substantial increases in asset prices (stocks, bonds, real estate, etc.), what impact will a decrease in money supply have?
Eric Van Enk is a wealth adviser & associate portfolio manager with National Bank Financial in Medicine Hat. He is a graduate of the University of Calgary, as well as a CFA charter holder with 20 years of financial markets experience in New York, Toronto and Calgary. He can be reached at eric.vanenk@nbc.ca.