Financial markets have recently experienced substantial turbulence, driven primarily by the U.S. and Israel attacking Iran and the subsequent impact on global oil and gas markets.
Approximately 20% of the world’s daily oil consumption travels through the Strait of Hormuz which is located just south of Iran and traffic through the Strait has effectively been halted since the attack began Feb. 28.
Most large countries and consumers of oil have strategic reserves or some form of local storage for oil and gas which helps mitigate supply disruptions in the short term.
However, the longer one fifth of the world’s oil supply remains restricted, the higher the probability these local storage buffers become exhausted, which would lead to product shortages and rationing.
Financial markets react instantaneously to news, and the largest market reaction has been to add ~ $30 to the price of oil since the war began. Higher oil and LNG prices have an impact on the cost of goods globally because they make shipping and manufacturing more expensive.
Inflation is negative for both stocks and bonds, which is why both asset classes have performed poorly since Feb. 28. However, it’s important to study history and to have perspective when considering making changes to your portfolio based on geopolitical events such as this.
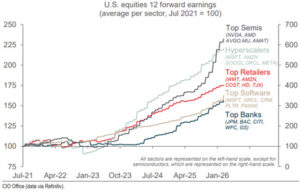
If you’ve read my prior columns, this theme will be familiar – long-term, successful investors focus on earnings. In this week’s chart, earnings growth estimates for the largest publicly traded companies in the U.S. are highlighted by subsector.
At the top of the chart in grey are the world’s largest semiconductor companies (NVIDIA, Broadcom, etc.), followed by the ‘Hyperscalers’ in light blue (Google, META, etc.), followed by retailers in red (Walmart, Costco, etc.), followed by software companies in brown (Microsoft, Oracle, etc.) and finally the big banks in blue (JP Morgan, Citigroup, etc.).
The chart highlights the magnitude of earnings growth for the world’s largest companies and begins in July of 2021. Notice how earnings growth remained flat during the COVID pandemic and began to surge as the global economy accelerated out of COVID in 2023 and accelerated again recently with the adoption of artificial intelligence.
What does history tell us? We’ve researched the market impact of geopolitical events and wars going back to Germany invading Poland in 1939.
The impact on the stock market (S&P 500) from these events varies from a minimum drawdown (sell-off) of 3% (1964 Gulf of Tonkin incident) to a maximum sell-off of 23% (September 11, 2001).
The average market drawdown of the 18 events we studied was 11.7% and the market impact of these events is driven, as one would expect, by the severity and duration of the conflict.
For short-term investors, stocks could move lower from current levels if this conflict escalates and isn’t resolved soon. For longer-term investors (5 years or more), these types of events and corresponding market selloffs represent excellent buying opportunities.
The bottom line is that trading around geopolitical events is extremely difficult, even for professional traders. This means the average investor should own a well-diversified portfolio with a focus on high quality companies and view market corrections from geopolitical events as buying opportunities.
Eric Van Enk is a wealth adviser & associate portfolio manager with National Bank Financial in Medicine Hat. He is a graduate of the University of Calgary, as well as a CFA charter holder with 20 years of financial markets experience in New York, Toronto and Calgary. He can be reached at eric.vanenk@nbc.ca