It’s been an interesting start to 2026 for financial markets with considerable volatility and widespread uncertainty regarding market direction. A lot of this uncertainty is a result of geopolitical events including Ukraine, Iran, Venezuela, etc. We’ve also seen President Trump continue his tariff rhetoric which adds to market uncertainty. Fortunately for markets, fourth quarter earnings season has generally been positive with earnings growth reported ahead of market expectations. This week’s chart provides insight into what we might expect for the balance of 2026 given it is a midterm election year in the U.S.
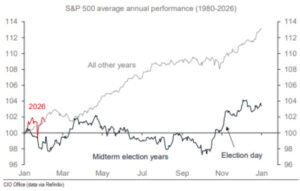
The chart shows the average annual performance for the S&P 500 index over the past ~45 years (1980 – 2026). Midterm election years are depicted in dark blue while all other years are shown in grey. Thus far, 2026 (red line) is tracking closer to the ‘all other’ average vs. the midterm average, yet the year is young.
Notice the average performance of the S&P 500 for U.S. midterm election years is substantially lower than non-midterm election years (~4% return vs. ~13%). Also notice the typical seasonality of midterm election years with the average annual positive performance of ~4% being earned post-election day in November.
This traditional ‘Santa Clause’ rally occurs once the market receives certainty from the election. This appears to be logical as markets dislike uncertainty.
Will 2026 be different? Time will tell, however, there are a few factors which I consider to be positive at time of writing. First, earnings growth for companies which comprise the S&P 500 have been strong and are accelerating.
Reasons for this include productivity growth driven by advances in artificial intelligence, declining interest rates as well as a U.S. administration which is supporting the economy by reducing taxes and promoting pro-growth policies.
Second, advanced polling for the U.S. midterm election in November is currently predicting the most likely outcome being a split between control of the House and Senate, followed by Democrats taking control of both the House and the Senate due to the declining popularity of President Trump and his policies.
Markets generally respond well to a balance of power between the Executive branch (pPresident), House of Representatives and Senate. If polls remain relatively consistent heading into November, the market may not have significant midterm uncertainty to overcome. However, if polls move back into President Trump’s favour, this could lead to additional market uncertainty and volatility.
Eric Van Enk is a wealth adviser & associate portfolio manager with National Bank Financial in Medicine Hat. He is a graduate of the University of Calgary, as well as a CFA charter holder with 20 years of financial markets experience in New York, Toronto and Calgary. He can be reached at eric.vanenk@nbc.ca