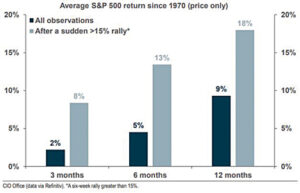
I found this week’s chart to be very interesting, and I hope you do too. The National Bank economics department has tracked S&P 500 returns going back to 1970 and segmented those returns into periods immediately following a sudden (greater than 15% return over a 6-week period) market rally versus all other observations. From there, we have further segmented the data into three, six, and twelve-month returns.
Average market returns since 1970 are shown in dark blue while market returns immediately following a significant market rally (greater than 15%) are shown in grey. Notice over a three, six, and twelve-month period, S&P 500 market returns have been meaningfully higher immediately following a sharp market rally (grey bars higher than blue bars in each period). These results may be counterintuitive to some, especially those who tend to view market returns through the lens of reversion to the mean.
Reversion to the mean is simply a sophisticated way of saying most data sets tend to produce results close to their historic mean (or average) over time. For example, if the average one-year return for the S&P 500 is 9% (dark blue 12-month return displayed in the chart) and the market has been experiencing several years of returns below 9%, we should expect returns above 9% at some point to average 9% over the long term. Although this may be true over longer timeframes, the data clearly shows it isn’t the case for periods of less than one year. As depicted in this week’s chart, three-month S&P 500 returns have averaged 2% since 1970, however, this average return quadruples to 8% immediately following a sharp market rally. The same is true over six and twelve-month periods where returns immediately following a sudden 15% market rally have substantially outpaced all other observations (13% vs. 5% over 6 months & 18% vs. 9% over 12 months).
The summary of the chart shows that S&P 500 returns tend to have momentum for periods of less than one year. Market rallies greater than 15% over a short period (6 weeks) have historically preceded periods of above average market performance. The obvious caveat is the chart is based on average returns since 1970, and past market returns should not be used to forecast future returns. However, there are many institutional investors that specialize in technical or quantitative analysis who look for these types of patterns in market behavior and use this data as part of their investment process.
Eric Van Enk is a wealth adviser & associate portfolio manager with National Bank Financial in Medicine Hat. He is a graduate of the University of Calgary, as well as a CFA charter holder with 20 years of financial markets experience in New York, Toronto and Calgary. He can be reached at eric.vanenk@nbc.ca