The market rally affectionately known as the “Trump bump” which occurred immediately following Trump’s election to a second term last November quickly succumbed to what I’m coining the Trump dump.
The stock market reacted negatively to increased tariff rhetoric from the Trump administration culminating in substantial panic selling following Trump’s “Liberation Day” announcement on April 2nd. Since then, we’ve seen a pivot from the White House towards a more conciliatory tone on tariffs and the S&P 500 responded with its largest daily percentage gain since 2008 occurring on April 9th.
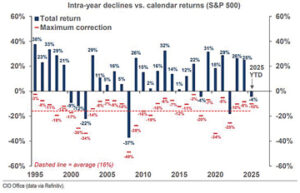
The supplied chart highlights the frequency of stock market corrections. Annual percentage corrections in the S&P 500 are shown in red while calendar returns for the S&P 500 are shown in blue. The red dashed line (-16%) represents the average annual correction since 1995.
This means, on average, the S&P 500 has experienced a 16% correction at some point during the year, each year, since 1995. Notice there have only been six years where the total return for the S&P 500 was negative since 1995 – three years in a row after the dot-com bubble burst in 2000, 2008 where the S&P 500 experienced its largest loss (-37%), 2018 and 2022.
For the other 24 years since 1995, investors made a lot of money buying the sell-off during the year as the market finished with a positive return.
The logical question is what will be the case for 2025 – is the correction the market has experienced year to date a buying opportunity or a harbinger of a larger sell-off?
The answer depends on the fundamentals which drive stock market performance, principally earnings and economic growth. Average earnings growth estimates for companies in the S&P 500 this year remain strong (greater than 10%) and earnings drive stock prices over the long term. However, earnings estimates are just that, estimates, meaning they can be wrong.
The largest factor which could substantially change estimates for earnings growth is the health of the economy. This is the reason President Trump’s trade war is creating stock market volatility. A prolonged global trade war would likely lead to a recession in Canada and the U.S. which would mean earnings estimates for publicly traded companies need to be revised lower.
History has shown that “normal” stock market corrections (24 of the 30 observations in the chart) are distinguished from more significant market corrections (i.e. 2008) based on whether the economy experienced a recession. Stock market corrections are larger and more pronounced if they coincide with a recession.
Economists view the stock market as a leading economic indicator due to its ability to efficiently discount information. Each public company announcement and economic data release is priced into markets shortly after its release which is what makes markets efficient over the medium term.
What makes the current correction unique is it has been caused by President Trump’s trade policies. Said another way, the current correction represents the market’s view on the probability of recession – the market is estimating whether Trump’s trade policies are a tactic for negotiating improved trade deals or whether they will be longer lasting, leading to an economic slowdown.
Have we already seen the market bottom in 2025? It really depends on whether Trump opts to make a deal or dig in his heels on his self-inflicted trade war.
Eric Van Enk is a wealth adviser & associate portfolio manager with National Bank Financial in Medicine Hat. He is a graduate of the University of Calgary, as well as a CFA charter holder with 20 years of financial markets experience in New York, Toronto and Calgary. He can be reached at eric.vanenk@nbc.ca